
Follow the document to the place.
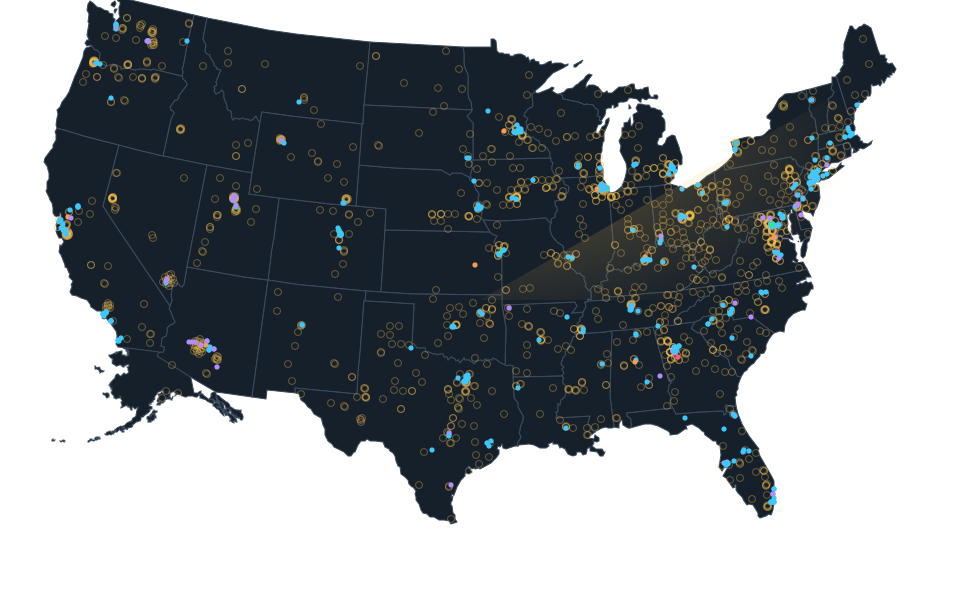
Use the atlas to find records, questions and original sources. Record totals describe this research collection. They are not a census of operating buildings.
Start here.
Open the mapCommunity concernsCoverage and evidenceDownload data
Read the scope.
Keep the source, date, subject and project phase with each claim. Proposed capacity is not measured use. An approval does not establish an opening. A concern record describes attributed documentation, not an Atlas finding of harm.
Pictures and maps.
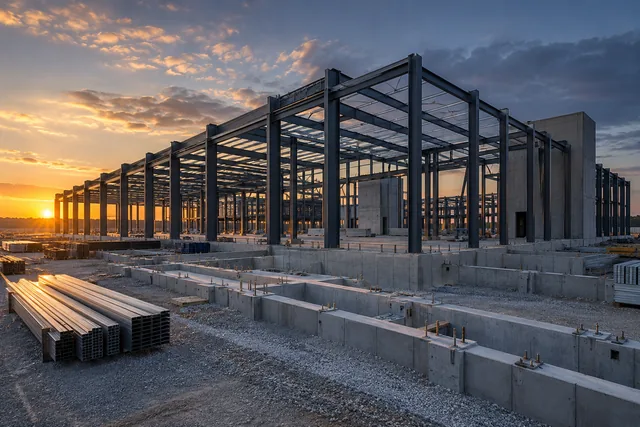
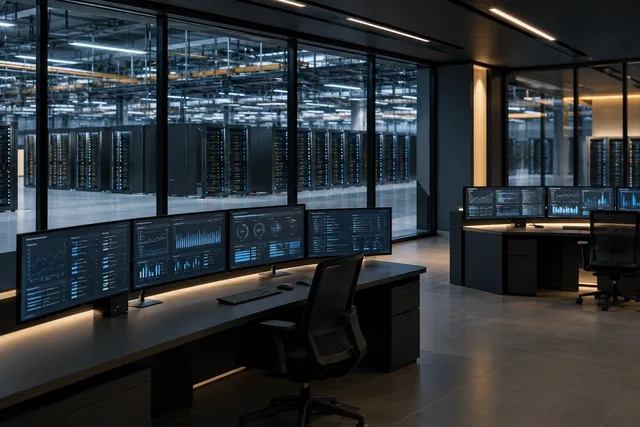
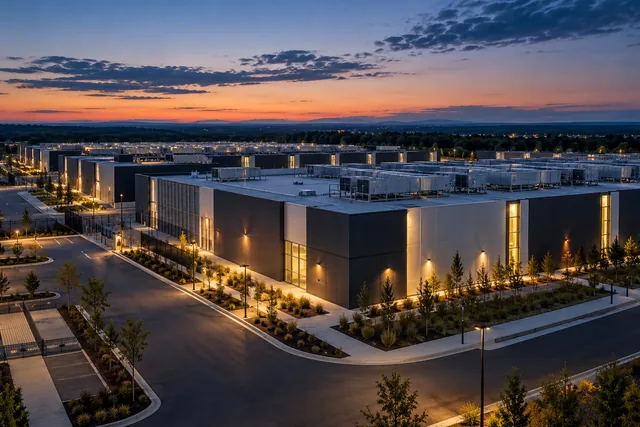
Decorative pictures on general pages are AI generated illustrations of fictional infrastructure. They must not be presented as photographs of a real project. Place pages use maps and linked evidence, with the location limits shown.
Methods and questions.
Read the research methods and credits, or learn what is inside a data center. For a correction or a reporting question, use Shaun Wilson Designs contact.
Put this map on your site
Copy the complete code, including the visible credit link. Locations and research labels keep their published limits.
October 2026: one headline number
The Atlas news log documents 69 source-dated entries in October 2026.
Selected documented entries, not a count of newly announced projects, operating buildings or all developments. Publication, review and scheduled event dates have different meanings.
Calculation: Count distinct entry IDs whose source publication date falls in this month and is no later than the snapshot date, with a retained source URL.
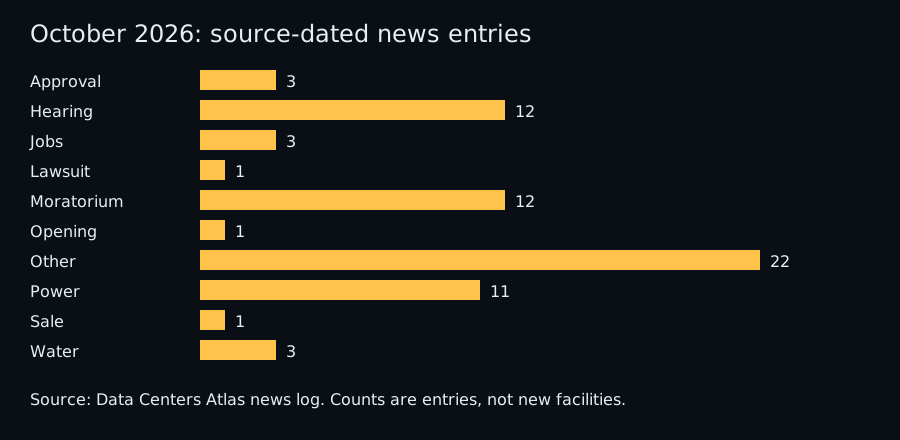
Updated . What changed: Dated news log reviewed; the monthly calculation retains every original source.