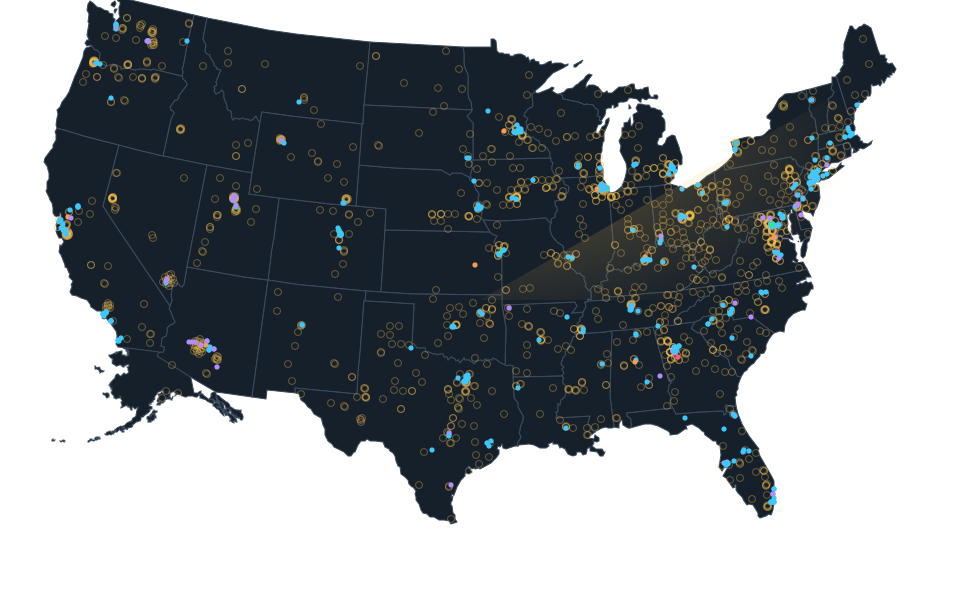



Who pays for power.
Selected utility and state proceedings. Other utilities and states are not yet reviewed. One utility tariff does not establish statewide coverage. Current and earlier captured electricity comparisons retain separate periods and sources.
Checked: October 28, 2026.
A request is not an approved connection or actual load. Approval documented for one utility does not establish a statewide rule or current effective rate. EIA labels current year residential prices preliminary. Price comparisons do not establish a cause or a household bill.
Evidence by state.
51 state rows shown
Alabama
Proposal documented
Alabama Power Company: Proposal documented.
August 2026: 16.33 cents per kWh. State residential average, not a data center tariff.
Sources: Alabama Public Service Commission filing by Alabama Power, Alabama Public Service Commission, U.S. Energy Information Administration.Alaska
Program requirements
Chugach Electric Association, Inc.: Program requirements.
August 2026: 29.41 cents per kWh. State residential average, not a data center tariff.
Sources: Chugach Electric Association, Inc., Chugach Electric Association, Inc., U.S. Energy Information Administration.Arizona
Proposal documented
Arizona Public Service Company: Proposal documented.
August 2026: 15.05 cents per kWh. State residential average, not a data center tariff.
Sources: Arizona Public Service Company, Arizona Corporation Commission, Arizona Corporation Commission, U.S. Energy Information Administration.Arkansas
Approval documented
Entergy Arkansas LPHLDS crypto mining class: Approval documented.
August 2026: 14.37 cents per kWh. State residential average, not a data center tariff.
Sources: Arkansas Public Service Commission, U.S. Energy Information Administration.California
Rulemaking opened
California advanced electric rate design: Rulemaking opened.
August 2026: 29.75 cents per kWh. State residential average, not a data center tariff.
Sources: California Public Utilities Commission, U.S. Energy Information Administration.Colorado
Mixed utility evidence
Xcel Energy Colorado: Proposal documented; Black Hills Colorado Electric doing business as Black Hills Energy: Approval documented.
August 2026: 17.17 cents per kWh. State residential average, not a data center tariff.
Sources: Colorado Public Utilities Commission, Colorado Public Utilities Commission, Colorado Public Utilities Commission, Colorado Public Utilities Commission, U.S. Energy Information Administration.Connecticut
Program requirements
The Connecticut Light and Power Company, doing business as Eversource Energy.: Program requirements.
August 2026: 24.51 cents per kWh. State residential average, not a data center tariff.
Sources: The Connecticut Light and Power Company, doing business as Eversource Energy, U.S. Energy Information Administration.Delaware
Proposal documented
Delmarva Power & Light Company: Proposal documented.
August 2026: 18.7 cents per kWh. State residential average, not a data center tariff.
Sources: Delaware Public Service Commission, Delaware Public Service Commission, U.S. Energy Information Administration.District of Columbia
Program requirements
Potomac Electric Power Company, Pepco: Program requirements.
August 2026: 25.98 cents per kWh. State residential average, not a data center tariff.
Sources: Pepco, U.S. Energy Information Administration.Open District of Columbia evidence
Read the District of Columbia layer page
Full source details load when opened.
Florida
Mixed utility evidence
Florida Power & Light Company: Approval documented; Tampa Electric Company: Proposal documented; Duke Energy Florida, LLC: Proposal documented.
August 2026: 14.99 cents per kWh. State residential average, not a data center tariff.
Sources: Florida Public Service Commission, Florida Public Service Commission, Florida Power & Light Company, Florida Public Service Commission filing by Tampa Electric Company, Florida Public Service Commission, Florida Public Service Commission filing by Duke Energy Florida, Florida Public Service Commission, U.S. Energy Information Administration.Georgia
Approval documented
Georgia Power: Approval documented.
August 2026: 15.9 cents per kWh. State residential average, not a data center tariff.
Sources: Georgia Public Service Commission, Georgia Public Service Commission, U.S. Energy Information Administration.Hawaii
Program requirements
Hawaiian Electric Company, Inc., Oahu: Program requirements; Hawaiian Electric Company, Inc., Oahu: Program requirements.
August 2026: 47.18 cents per kWh. State residential average, not a data center tariff.
Sources: Hawaiian Electric Company, Inc., Hawaiian Electric Company, Inc., U.S. Energy Information Administration.Idaho
Approval documented
Idaho Power: Approval documented.
August 2026: 13.37 cents per kWh. State residential average, not a data center tariff.
Sources: Idaho Public Utilities Commission, Idaho Power, U.S. Energy Information Administration.Illinois
Approval documented
Commonwealth Edison Company (ComEd): Approval documented.
August 2026: 19.32 cents per kWh. State residential average, not a data center tariff.
Sources: Illinois Commerce Commission, U.S. Energy Information Administration.Indiana
Approval documented
Indiana Michigan Power: Approval documented.
August 2026: 17.02 cents per kWh. State residential average, not a data center tariff.
Sources: Indiana Utility Regulatory Commission, U.S. Energy Information Administration.Iowa
Program requirements
Interstate Power and Light Company, Alliant Energy Iowa: Program requirements.
August 2026: 17.06 cents per kWh. State residential average, not a data center tariff.
Sources: Interstate Power and Light Company, Alliant Energy, U.S. Energy Information Administration.Kansas
Approval documented
Evergy Kansas Metro, Kansas South and Kansas Central: Approval documented.
August 2026: 15.47 cents per kWh. State residential average, not a data center tariff.
Sources: Kansas Corporation Commission, U.S. Energy Information Administration.Kentucky
Approval documented
East Kentucky Power Cooperative: Approval documented; Kentucky Utilities: Approval documented; Louisville Gas and Electric: Approval documented; Kentucky Power Company: Approval documented.
August 2026: 13.8 cents per kWh. State residential average, not a data center tariff.
Sources: Kentucky Public Service Commission, Kentucky Public Service Commission, Kentucky Public Service Commission, Kentucky Public Service Commission, U.S. Energy Information Administration.Louisiana
Approval documented
Entergy Louisiana: Approval documented.
August 2026: 12.87 cents per kWh. State residential average, not a data center tariff.
Sources: Louisiana Public Service Commission, Entergy Louisiana and Louisiana Public Service Commission Staff, Entergy Louisiana filing with Louisiana Public Service Commission, U.S. Energy Information Administration.Maine
Program requirements
Eastern Maine Electric Cooperative, Inc.: Program requirements.
August 2026: 32.11 cents per kWh. State residential average, not a data center tariff.
Sources: Eastern Maine Electric Cooperative, Inc., Eastern Maine Electric Cooperative, Inc., U.S. Energy Information Administration.Maryland
Proposal documented
Southern Maryland Electric Cooperative, SMECO: Proposal documented.
August 2026: 21.4 cents per kWh. State residential average, not a data center tariff.
Sources: Southern Maryland Electric Cooperative, Southern Maryland Electric Cooperative, U.S. Energy Information Administration.Massachusetts
Program requirements
Fitchburg Gas and Electric Light Company, doing business as Unitil: Program requirements.
August 2026: 30.48 cents per kWh. State residential average, not a data center tariff.
Sources: Fitchburg Gas and Electric Light Company, Unitil, Fitchburg Gas and Electric Light Company, Unitil, U.S. Energy Information Administration.Michigan
Approval documented
Indiana Michigan Power Company in Michigan: Approval documented; Consumers Energy Company: Approval documented.
August 2026: 22.99 cents per kWh. State residential average, not a data center tariff.
Sources: Michigan Public Service Commission, Michigan Public Service Commission, U.S. Energy Information Administration.Minnesota
Mixed utility evidence
Xcel Energy: Approval documented; Minnesota Power: Proposal documented; Dakota Electric Association: Proposal documented.
August 2026: 17.2 cents per kWh. State residential average, not a data center tariff.
Sources: Minnesota Public Utilities Commission, Minnesota Public Utilities Commission, Minnesota Public Utilities Commission, Minnesota Public Utilities Commission, U.S. Energy Information Administration.Mississippi
Program requirements
Columbus Light and Water: Program requirements.
August 2026: 14.43 cents per kWh. State residential average, not a data center tariff.
Sources: PowerCompute issuer hosted copy of filed Exhibit10.1, PowerCompute issuer hosted Form8K, U.S. Energy Information Administration.Missouri
Mixed utility evidence
Union Electric Company doing business as Ameren Missouri: Approval documented; Evergy Missouri West: Approval documented; The Empire District Electric Company doing business as Liberty: Proposal documented; Evergy Metro doing business as Evergy Missouri Metro: Approval documented.
August 2026: 16.02 cents per kWh. State residential average, not a data center tariff.
Sources: Missouri Public Service Commission, Missouri Public Service Commission, Missouri Public Service Commission, Missouri Public Service Commission, Missouri Public Service Commission, Missouri Public Service Commission, Missouri Public Service Commission, U.S. Energy Information Administration.Montana
Proposal documented
NorthWestern Energy Montana: Proposal documented.
August 2026: 15.57 cents per kWh. State residential average, not a data center tariff.
Sources: NorthWestern Energy, Montana Governor Office, U.S. Energy Information Administration.Nebraska
Approval documented
Omaha Public Power District (OPPD): Approval documented.
August 2026: 13.54 cents per kWh. State residential average, not a data center tariff.
Sources: Omaha Public Power District, Omaha Public Power District, U.S. Energy Information Administration.Nevada
Proposal documented
Nevada Power Company and Sierra Pacific Power Company, NV Energy: Proposal documented.
August 2026: 12.72 cents per kWh. State residential average, not a data center tariff.
Sources: Nevada Power Company and Sierra Pacific Power Company, Nevada Office of the Attorney General, U.S. Energy Information Administration.New Hampshire
Program requirements
Unitil Energy Systems, Inc.: Program requirements.
August 2026: 27.64 cents per kWh. State residential average, not a data center tariff.
Sources: Unitil Energy Systems, Inc., Unitil Energy Systems, Inc., U.S. Energy Information Administration.New Jersey
Program requirements
Jersey Central Power and Light Company.: Program requirements.
August 2026: 24.61 cents per kWh. State residential average, not a data center tariff.
Sources: Jersey Central Power and Light Company, Jersey Central Power and Light Company, U.S. Energy Information Administration.New Mexico
Approval documented
Public Service Company of New Mexico, PNM: Approval documented.
August 2026: 16.51 cents per kWh. State residential average, not a data center tariff.
Sources: New Mexico Public Regulation Commission, U.S. Energy Information Administration.New York
Rulemaking opened
New York PSC large load interconnection proceeding: Rulemaking opened.
August 2026: 28.65 cents per kWh. State residential average, not a data center tariff.
Sources: New York Public Service Commission, New York Public Service Commission, U.S. Energy Information Administration.North Carolina
Proposal documented
Duke Energy Carolinas and Duke Energy Progress: Proposal documented.
August 2026: 14.95 cents per kWh. State residential average, not a data center tariff.
Sources: North Carolina Department of Justice, U.S. Energy Information Administration.North Dakota
Proposal documented
Otter Tail Power Company: Proposal documented.
August 2026: 13.31 cents per kWh. State residential average, not a data center tariff.
Sources: North Dakota Public Service Commission, North Dakota Public Service Commission, North Dakota Public Service Commission, U.S. Energy Information Administration.Ohio
Approval documented
AEP Ohio: Approval documented.
August 2026: 19.38 cents per kWh. State residential average, not a data center tariff.
Sources: Office of the Ohio Consumers Counsel, U.S. Energy Information Administration.Oklahoma
Proposal documented
Oklahoma Gas and Electric Company: Proposal documented; Public Service Company of Oklahoma: Proposal documented.
August 2026: 14.82 cents per kWh. State residential average, not a data center tariff.
Sources: Oklahoma Gas and Electric Company, Oklahoma Gas and Electric Company, Public Service Company of Oklahoma, U.S. Energy Information Administration.Oregon
Mixed utility evidence
Portland General Electric: Approval documented; PacifiCorp (Pacific Power): Proposal documented.
August 2026: 15.92 cents per kWh. State residential average, not a data center tariff.
Sources: Oregon Public Utility Commission, Oregon Public Utility Commission, PacifiCorp and stipulating parties, Oregon Public Utility Commission, Oregon Public Utility Commission, U.S. Energy Information Administration.Pennsylvania
Approval documented
PPL Electric Utilities: Approval documented.
August 2026: 21.77 cents per kWh. State residential average, not a data center tariff.
Sources: Pennsylvania Public Utility Commission, Pennsylvania Public Utility Commission, U.S. Energy Information Administration.Rhode Island
Program requirements
The Narragansett Electric Company, doing business as Rhode Island Energy.: Program requirements.
August 2026: 28.18 cents per kWh. State residential average, not a data center tariff.
Sources: The Narragansett Electric Company, doing business as Rhode Island Energy, The Narragansett Electric Company, doing business as Rhode Island Energy, U.S. Energy Information Administration.South Carolina
Approval documented
Duke Energy Carolinas, LLC: Approval documented.
August 2026: 15.76 cents per kWh. State residential average, not a data center tariff.
Sources: Public Service Commission of South Carolina, Public Service Commission of South Carolina, U.S. Energy Information Administration.South Dakota
Approval documented
Black Hills Power, Inc. d/b/a Black Hills Energy: Approval documented.
August 2026: 15.15 cents per kWh. State residential average, not a data center tariff.
Sources: South Dakota Public Utilities Commission, U.S. Energy Information Administration.Tennessee
Approval documented
Tennessee Valley Authority: Approval documented.
August 2026: 13.42 cents per kWh. State residential average, not a data center tariff.
Sources: Tennessee Valley Authority, Tennessee Valley Authority, U.S. Energy Information Administration.Texas
Approval documented
El Paso Electric Company: Approval documented; El Paso Electric Company: Approval documented.
August 2026: 15.91 cents per kWh. State residential average, not a data center tariff.
Sources: Public Utility Commission of Texas, U.S. Energy Information Administration.Utah
Rulemaking opened
Rocky Mountain Power: Rulemaking opened.
August 2026: 13.31 cents per kWh. State residential average, not a data center tariff.
Sources: Public Service Commission of Utah, Public Service Commission of Utah, Public Service Commission of Utah, U.S. Energy Information Administration.Vermont
Program requirements
Green Mountain Power: Program requirements.
August 2026: 23.84 cents per kWh. State residential average, not a data center tariff.
Sources: Green Mountain Power, U.S. Energy Information Administration.Virginia
Approval documented
Virginia Electric and Power Company (Dominion): Approval documented; Appalachian Power Company in Virginia: Approval documented.
August 2026: 17.64 cents per kWh. State residential average, not a data center tariff.
Sources: Virginia State Corporation Commission, Virginia State Corporation Commission, U.S. Energy Information Administration.Washington
Mixed utility evidence
Grant PUD Evolving Industry Rate 17: Approval documented; Grant PUD proposed 2027 high density compute classes: Proposal documented.
August 2026: 14.63 cents per kWh. State residential average, not a data center tariff.
Sources: Grant County Public Utility District, Grant County Public Utility District, Grant County Public Utility District, U.S. Energy Information Administration.West Virginia
Approval documented
Appalachian Power Company and Wheeling Power Company: Approval documented.
August 2026: 16.31 cents per kWh. State residential average, not a data center tariff.
Sources: Public Service Commission of West Virginia, U.S. Energy Information Administration.Wisconsin
Approval documented
Wisconsin Electric Power Company: Approval documented.
August 2026: 19.41 cents per kWh. State residential average, not a data center tariff.
Sources: Public Service Commission of Wisconsin, U.S. Energy Information Administration.Wyoming
Proposal documented
Cheyenne Light, Fuel and Power Company d/b/a Black Hills Energy: Proposal documented.
August 2026: 14.43 cents per kWh. State residential average, not a data center tariff.
Sources: Wyoming Public Service Commission, U.S. Energy Information Administration.
National context.
EIA August comparison release date confirmed in a later capture
Source publication evidence for the unchanged August state comparison. The earlier capture date conflict remains in source history. A scheduled next release is not treated as a future event outcome.
U.S. Energy Information Administration. Source: October 23, 2026. Checked: October 23, 2026.Full source details load when opened.
United States solar photovoltaic capacity 2016
MW capacity, not generation. Annual source totals and monthly observations stay separate. Small scale sectors overlap their total.
U.S. Energy Information Administration. Source: October 23, 2026. Checked: October 27, 2026.Full source details load when opened.
United States solar photovoltaic capacity 2017
MW capacity, not generation. Annual source totals and monthly observations stay separate. Small scale sectors overlap their total.
U.S. Energy Information Administration. Source: October 23, 2026. Checked: October 27, 2026.Full source details load when opened.
United States solar photovoltaic capacity 2018
MW capacity, not generation. Annual source totals and monthly observations stay separate. Small scale sectors overlap their total.
U.S. Energy Information Administration. Source: October 23, 2026. Checked: October 27, 2026.Full source details load when opened.
United States solar photovoltaic capacity 2019
MW capacity, not generation. Annual source totals and monthly observations stay separate. Small scale sectors overlap their total.
U.S. Energy Information Administration. Source: October 23, 2026. Checked: October 27, 2026.Full source details load when opened.
United States solar photovoltaic capacity 2020
MW capacity, not generation. Annual source totals and monthly observations stay separate. Small scale sectors overlap their total.
U.S. Energy Information Administration. Source: October 23, 2026. Checked: October 27, 2026.Full source details load when opened.
United States solar photovoltaic capacity 2021
MW capacity, not generation. Annual source totals and monthly observations stay separate. Small scale sectors overlap their total.
U.S. Energy Information Administration. Source: October 23, 2026. Checked: October 27, 2026.Full source details load when opened.
United States solar photovoltaic capacity 2022
MW capacity, not generation. Annual source totals and monthly observations stay separate. Small scale sectors overlap their total.
U.S. Energy Information Administration. Source: October 23, 2026. Checked: October 27, 2026.Full source details load when opened.
United States solar photovoltaic capacity 2023
MW capacity, not generation. Annual source totals and monthly observations stay separate. Small scale sectors overlap their total.
U.S. Energy Information Administration. Source: October 23, 2026. Checked: October 27, 2026.Full source details load when opened.
United States solar photovoltaic capacity 2024
MW capacity, not generation. Annual source totals and monthly observations stay separate. Small scale sectors overlap their total.
U.S. Energy Information Administration. Source: October 23, 2026. Checked: October 27, 2026.Full source details load when opened.
United States solar photovoltaic capacity 2025
MW capacity, not generation. Annual source totals and monthly observations stay separate. Small scale sectors overlap their total.
U.S. Energy Information Administration. Source: October 23, 2026. Checked: October 27, 2026.Full source details load when opened.
United States solar photovoltaic capacity 2024-01
MW capacity, not generation. Annual source totals and monthly observations stay separate. Small scale sectors overlap their total.
U.S. Energy Information Administration. Source: October 23, 2026. Checked: October 27, 2026.Full source details load when opened.
United States solar photovoltaic capacity 2024-02
MW capacity, not generation. Annual source totals and monthly observations stay separate. Small scale sectors overlap their total.
U.S. Energy Information Administration. Source: October 23, 2026. Checked: October 27, 2026.Full source details load when opened.
United States solar photovoltaic capacity 2024-03
MW capacity, not generation. Annual source totals and monthly observations stay separate. Small scale sectors overlap their total.
U.S. Energy Information Administration. Source: October 23, 2026. Checked: October 27, 2026.Full source details load when opened.
United States solar photovoltaic capacity 2024-04
MW capacity, not generation. Annual source totals and monthly observations stay separate. Small scale sectors overlap their total.
U.S. Energy Information Administration. Source: October 23, 2026. Checked: October 27, 2026.Full source details load when opened.
United States solar photovoltaic capacity 2024-05
MW capacity, not generation. Annual source totals and monthly observations stay separate. Small scale sectors overlap their total.
U.S. Energy Information Administration. Source: October 23, 2026. Checked: October 27, 2026.Full source details load when opened.
United States solar photovoltaic capacity 2024-06
MW capacity, not generation. Annual source totals and monthly observations stay separate. Small scale sectors overlap their total.
U.S. Energy Information Administration. Source: October 23, 2026. Checked: October 27, 2026.Full source details load when opened.
United States solar photovoltaic capacity 2024-07
MW capacity, not generation. Annual source totals and monthly observations stay separate. Small scale sectors overlap their total.
U.S. Energy Information Administration. Source: October 23, 2026. Checked: October 27, 2026.Full source details load when opened.
United States solar photovoltaic capacity 2024-08
MW capacity, not generation. Annual source totals and monthly observations stay separate. Small scale sectors overlap their total.
U.S. Energy Information Administration. Source: October 23, 2026. Checked: October 27, 2026.Full source details load when opened.
United States solar photovoltaic capacity 2024-09
MW capacity, not generation. Annual source totals and monthly observations stay separate. Small scale sectors overlap their total.
U.S. Energy Information Administration. Source: October 23, 2026. Checked: October 27, 2026.Full source details load when opened.
United States solar photovoltaic capacity 2024-10
MW capacity, not generation. Annual source totals and monthly observations stay separate. Small scale sectors overlap their total.
U.S. Energy Information Administration. Source: October 23, 2026. Checked: October 27, 2026.Full source details load when opened.
United States solar photovoltaic capacity 2024-11
MW capacity, not generation. Annual source totals and monthly observations stay separate. Small scale sectors overlap their total.
U.S. Energy Information Administration. Source: October 23, 2026. Checked: October 27, 2026.Full source details load when opened.
United States solar photovoltaic capacity 2024-12
MW capacity, not generation. Annual source totals and monthly observations stay separate. Small scale sectors overlap their total.
U.S. Energy Information Administration. Source: October 23, 2026. Checked: October 27, 2026.Full source details load when opened.
United States solar photovoltaic capacity 2025-01
MW capacity, not generation. Annual source totals and monthly observations stay separate. Small scale sectors overlap their total.
U.S. Energy Information Administration. Source: October 23, 2026. Checked: October 27, 2026.Full source details load when opened.
United States solar photovoltaic capacity 2025-02
MW capacity, not generation. Annual source totals and monthly observations stay separate. Small scale sectors overlap their total.
U.S. Energy Information Administration. Source: October 23, 2026. Checked: October 27, 2026.Full source details load when opened.
United States solar photovoltaic capacity 2025-03
MW capacity, not generation. Annual source totals and monthly observations stay separate. Small scale sectors overlap their total.
U.S. Energy Information Administration. Source: October 23, 2026. Checked: October 27, 2026.Full source details load when opened.
United States solar photovoltaic capacity 2025-04
MW capacity, not generation. Annual source totals and monthly observations stay separate. Small scale sectors overlap their total.
U.S. Energy Information Administration. Source: October 23, 2026. Checked: October 27, 2026.Full source details load when opened.
United States solar photovoltaic capacity 2025-05
MW capacity, not generation. Annual source totals and monthly observations stay separate. Small scale sectors overlap their total.
U.S. Energy Information Administration. Source: October 23, 2026. Checked: October 27, 2026.Full source details load when opened.
United States solar photovoltaic capacity 2025-06
MW capacity, not generation. Annual source totals and monthly observations stay separate. Small scale sectors overlap their total.
U.S. Energy Information Administration. Source: October 23, 2026. Checked: October 27, 2026.Full source details load when opened.
United States solar photovoltaic capacity 2025-07
MW capacity, not generation. Annual source totals and monthly observations stay separate. Small scale sectors overlap their total.
U.S. Energy Information Administration. Source: October 23, 2026. Checked: October 27, 2026.Full source details load when opened.
United States solar photovoltaic capacity 2025-08
MW capacity, not generation. Annual source totals and monthly observations stay separate. Small scale sectors overlap their total.
U.S. Energy Information Administration. Source: October 23, 2026. Checked: October 27, 2026.Full source details load when opened.
United States solar photovoltaic capacity 2025-09
MW capacity, not generation. Annual source totals and monthly observations stay separate. Small scale sectors overlap their total.
U.S. Energy Information Administration. Source: October 23, 2026. Checked: October 27, 2026.Full source details load when opened.
United States solar photovoltaic capacity 2025-10
MW capacity, not generation. Annual source totals and monthly observations stay separate. Small scale sectors overlap their total.
U.S. Energy Information Administration. Source: October 23, 2026. Checked: October 27, 2026.Full source details load when opened.
United States solar photovoltaic capacity 2025-11
MW capacity, not generation. Annual source totals and monthly observations stay separate. Small scale sectors overlap their total.
U.S. Energy Information Administration. Source: October 23, 2026. Checked: October 27, 2026.Full source details load when opened.
United States solar photovoltaic capacity 2025-12
MW capacity, not generation. Annual source totals and monthly observations stay separate. Small scale sectors overlap their total.
U.S. Energy Information Administration. Source: October 23, 2026. Checked: October 27, 2026.Full source details load when opened.
United States solar photovoltaic capacity 2026-01
MW capacity, not generation. Annual source totals and monthly observations stay separate. Small scale sectors overlap their total.
U.S. Energy Information Administration. Source: October 23, 2026. Checked: October 27, 2026.Full source details load when opened.
United States solar photovoltaic capacity 2026-02
MW capacity, not generation. Annual source totals and monthly observations stay separate. Small scale sectors overlap their total.
U.S. Energy Information Administration. Source: October 23, 2026. Checked: October 27, 2026.Full source details load when opened.
United States solar photovoltaic capacity 2026-03
MW capacity, not generation. Annual source totals and monthly observations stay separate. Small scale sectors overlap their total.
U.S. Energy Information Administration. Source: October 23, 2026. Checked: October 27, 2026.Full source details load when opened.
United States solar photovoltaic capacity 2026-04
MW capacity, not generation. Annual source totals and monthly observations stay separate. Small scale sectors overlap their total.
U.S. Energy Information Administration. Source: October 23, 2026. Checked: October 27, 2026.Full source details load when opened.
United States solar photovoltaic capacity 2026-05
MW capacity, not generation. Annual source totals and monthly observations stay separate. Small scale sectors overlap their total.
U.S. Energy Information Administration. Source: October 23, 2026. Checked: October 27, 2026.Full source details load when opened.
United States solar photovoltaic capacity 2026-06
MW capacity, not generation. Annual source totals and monthly observations stay separate. Small scale sectors overlap their total.
U.S. Energy Information Administration. Source: October 23, 2026. Checked: October 27, 2026.Full source details load when opened.
United States solar photovoltaic capacity 2026-07
MW capacity, not generation. Annual source totals and monthly observations stay separate. Small scale sectors overlap their total.
U.S. Energy Information Administration. Source: October 23, 2026. Checked: October 27, 2026.Full source details load when opened.
United States solar photovoltaic capacity 2026-08
MW capacity, not generation. Annual source totals and monthly observations stay separate. Small scale sectors overlap their total.
U.S. Energy Information Administration. Source: October 23, 2026. Checked: October 27, 2026.Full source details load when opened.
National demand response2016 through2025
National2016 through2025 program data. Potential MW, actual MW, MWh and enrollments differ. Energy savings have a2023reclassification.
U.S. Energy Information Administration. Source: October 21, 2026. Checked: October 28, 2026.Full source details load when opened.
Latest source reviews.
National demand response2016 through2025
Historical record. Historical national EIA Table10.3 demand-response program savings2016-2025,not state or data center figures. Customer enrollments are reported program customers,not unique people,physical sites or an approved MW queue. Energy savings are MWh;potential and actual peak demand savings are separate MW measures,not energy,available supply or firm capacity and must not be added. Sector totals overlap component sectors. Source notes energy savings dropped due to a reclassification in2023annual filings;do not interpret that discontinuity as a measured physical collapse or data center effect. The table caption says2013through2025 but the reviewed body supplies only2016through2025;no missing years invented. Source double dashes have no individual explanation here and remain unknown,not zero or no participation. Published totals and rounded sector figures are retained without forcing balance. No state/utility/facility attribution,Native joins,current2026 activity or customer-specific curtailment.
U.S. Energy Information Administration. Source: October 21, 2026. Checked: October 28, 2026.Alaska historical IEEE distribution reliability2025 and2024
Historical record. EIA Electric Power Annual Table11.2 historical2025 and2024 distribution-system reliability reported using IEEE1366. Coverage varies by state and year;percent of customers reported is meters on the reliability schedule divided by customers on the sales schedule and can exceed100percent,not a probability or uptime percentage. SAIDI is annual minutes of non-momentary interruptions experienced by the average customer;SAIFI is annual number of interruptions;CAIDI is minutes per interruption. All events,without major event days,and loss of supply removed are distinct series,not additive. Loss of supply removed excludes high-voltage/bulk-system supply-loss outages,not all major events. Source blanks remain unknown with no stated individual cause;literal source zeros remain zero. No complete utility census,site-specific uptime,SLA,transmission reliability,capacity availability,data center load effect or causal attribution.
U.S. Energy Information Administration. Source: October 21, 2026. Checked: October 27, 2026.Alabama historical IEEE distribution reliability2025 and2024
Historical record. EIA Electric Power Annual Table11.2 historical2025 and2024 distribution-system reliability reported using IEEE1366. Coverage varies by state and year;percent of customers reported is meters on the reliability schedule divided by customers on the sales schedule and can exceed100percent,not a probability or uptime percentage. SAIDI is annual minutes of non-momentary interruptions experienced by the average customer;SAIFI is annual number of interruptions;CAIDI is minutes per interruption. All events,without major event days,and loss of supply removed are distinct series,not additive. Loss of supply removed excludes high-voltage/bulk-system supply-loss outages,not all major events. Source blanks remain unknown with no stated individual cause;literal source zeros remain zero. No complete utility census,site-specific uptime,SLA,transmission reliability,capacity availability,data center load effect or causal attribution.
U.S. Energy Information Administration. Source: October 21, 2026. Checked: October 27, 2026.
Only states with sourced items have layer pages. A missing review is not a finding that a tariff, permit, program or reporting rule is absent.
Explore the infrastructure layers.
Download these findings with their sources
Unknown fields are withheld. The Atlas compilation license remains awaiting the owner decision. Original source terms and credits remain separate.
Updated . What changed: Latest source review in this evidence collection. It does not establish a site outcome.