

Water disclosure and use.
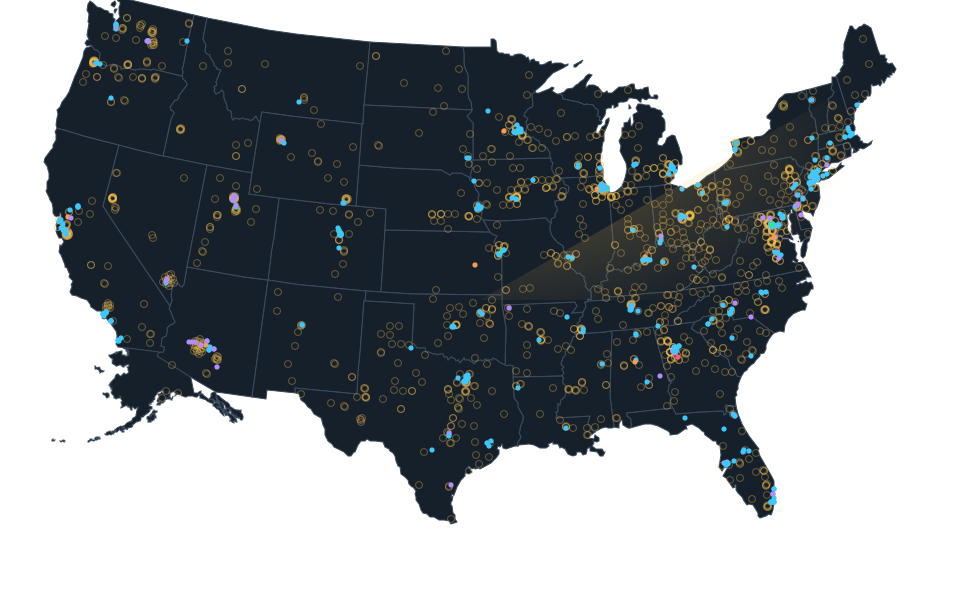
Selected state reporting laws and proposals, annual operator disclosures and construction dewatering permits. Withdrawal, consumption, discharge, supply allocations and forecasts are different measures. Coverage is incomplete.
Checked: October 27, 2026.
Water withdrawn, water consumed, supply allocation and future demand are different measures. Reporting requirements do not establish that reports were filed.
Evidence by state.
51 state rows shown
Alabama
Historical record
4 sourced items are documented. Reporting duties, permitted quantities and reported use retain separate meanings.
Sources: Google, Meta Platforms, U.S. Geological Survey, U.S. Geological Survey, U.S. Geological Survey, U.S. Geological Survey.Alaska
Historical record, Program requirements
2 sourced items are documented. Reporting duties, permitted quantities and reported use retain separate meanings.
Sources: Alaska Department of Natural Resources, Alaska Department of Natural Resources, U.S. Geological Survey.Arizona
Historical record
6 sourced items are documented. Reporting duties, permitted quantities and reported use retain separate meanings.
Sources: Google, Meta Platforms, Microsoft, U.S. Geological Survey, U.S. Geological Survey, U.S. Geological Survey, U.S. Geological Survey.Arkansas
Historical record, Program requirements
3 sourced items are documented. Reporting duties, permitted quantities and reported use retain separate meanings.
Sources: Code of Arkansas Rules, Code of Arkansas Rules, U.S. Geological Survey, U.S. Geological Survey, U.S. Geological Survey, U.S. Geological Survey.California
Enacted, Historical record
3 sourced items are documented. Reporting duties, permitted quantities and reported use retain separate meanings.
Sources: California Assemblymember Diane Papan, U.S. Geological Survey, U.S. Geological Survey, U.S. Geological Survey, U.S. Geological Survey.Colorado
Historical record
4 sourced items are documented. Reporting duties, permitted quantities and reported use retain separate meanings.
Sources: Colorado Legislative Council Staff, Colorado General Assembly, Colorado General Assembly, Colorado General Assembly and Legislative Council Staff, Colorado General Assembly and Legislative Council Staff, U.S. Geological Survey, U.S. Geological Survey, U.S. Geological Survey, U.S. Geological Survey.Connecticut
Historical record, Program requirements
3 sourced items are documented. Reporting duties, permitted quantities and reported use retain separate meanings.
Sources: Connecticut Department of Energy and Environmental Protection, U.S. Geological Survey, U.S. Geological Survey, U.S. Geological Survey, U.S. Geological Survey.Delaware
Historical record, Program requirements
3 sourced items are documented. Reporting duties, permitted quantities and reported use retain separate meanings.
Sources: Delaware DNREC, Delaware DNREC, U.S. Geological Survey, U.S. Geological Survey, U.S. Geological Survey, U.S. Geological Survey.District of Columbia
Historical record, Program requirements
2 sourced items are documented. Reporting duties, permitted quantities and reported use retain separate meanings.
Sources: DC Water, U.S. Geological Survey.Open District of Columbia evidence
Read the District of Columbia layer page
Full source details load when opened.
Florida
Enacted, Historical record
3 sourced items are documented. Reporting duties, permitted quantities and reported use retain separate meanings.
Sources: Florida Department of State, Laws of Florida, U.S. Geological Survey, U.S. Geological Survey, U.S. Geological Survey, U.S. Geological Survey.Georgia
Historical record
5 sourced items are documented. Reporting duties, permitted quantities and reported use retain separate meanings.
Sources: Google, Meta Platforms, Microsoft, U.S. Geological Survey, U.S. Geological Survey, U.S. Geological Survey, U.S. Geological Survey.Hawaii
Historical record, Program requirements
2 sourced items are documented. Reporting duties, permitted quantities and reported use retain separate meanings.
Sources: Hawaii Commission on Water Resource Management, U.S. Geological Survey.Idaho
Historical record, Program requirements
3 sourced items are documented. Reporting duties, permitted quantities and reported use retain separate meanings.
Sources: Idaho Department of Environmental Quality, U.S. Geological Survey, U.S. Geological Survey, U.S. Geological Survey, U.S. Geological Survey.Illinois
Historical record
4 sourced items are documented. Reporting duties, permitted quantities and reported use retain separate meanings.
Sources: Meta Platforms, Microsoft, U.S. Geological Survey, U.S. Geological Survey, U.S. Geological Survey, U.S. Geological Survey.Indiana
Historical record
3 sourced items are documented. Reporting duties, permitted quantities and reported use retain separate meanings.
Sources: Google, U.S. Geological Survey, U.S. Geological Survey, U.S. Geological Survey, U.S. Geological Survey.Iowa
Historical record, Program requirements
6 sourced items are documented. Reporting duties, permitted quantities and reported use retain separate meanings.
Sources: Google, Meta Platforms, Microsoft, Iowa Department of Natural Resources, U.S. Geological Survey, U.S. Geological Survey, U.S. Geological Survey, U.S. Geological Survey.Kansas
Historical record, Program requirements
3 sourced items are documented. Reporting duties, permitted quantities and reported use retain separate meanings.
Sources: Kansas Office of Revisor of Statutes, U.S. Geological Survey, U.S. Geological Survey, U.S. Geological Survey, U.S. Geological Survey.Kentucky
Historical record
3 sourced items are documented. Reporting duties, permitted quantities and reported use retain separate meanings.
Sources: Kentucky Legislative Research Commission, U.S. Geological Survey, U.S. Geological Survey, U.S. Geological Survey, U.S. Geological Survey.Louisiana
Historical record, Pending in source
3 sourced items are documented. Reporting duties, permitted quantities and reported use retain separate meanings.
Sources: Louisiana Legislature, U.S. Geological Survey, U.S. Geological Survey, U.S. Geological Survey, U.S. Geological Survey.Maine
Historical record, Program requirements
3 sourced items are documented. Reporting duties, permitted quantities and reported use retain separate meanings.
Sources: Maine Legislature, Maine Legislature, Maine Legislature, Maine Legislature, U.S. Geological Survey, U.S. Geological Survey, U.S. Geological Survey, U.S. Geological Survey.Maryland
Historical record, Permit issued
4 sourced items are documented. Reporting duties, permitted quantities and reported use retain separate meanings.
Sources: Maryland Department of the Environment, Maryland Department of the Environment, U.S. Geological Survey, U.S. Geological Survey, U.S. Geological Survey, U.S. Geological Survey.Massachusetts
Historical record, Proposal documented
3 sourced items are documented. Reporting duties, permitted quantities and reported use retain separate meanings.
Sources: Massachusetts General Court, U.S. Geological Survey, U.S. Geological Survey, U.S. Geological Survey, U.S. Geological Survey.Michigan
Historical record, Program requirements
3 sourced items are documented. Reporting duties, permitted quantities and reported use retain separate meanings.
Sources: Michigan EGLE, Michigan Legislature, Michigan Legislature, U.S. Geological Survey, U.S. Geological Survey, U.S. Geological Survey, U.S. Geological Survey.Minnesota
Historical record, Proposal documented
3 sourced items are documented. Reporting duties, permitted quantities and reported use retain separate meanings.
Sources: Minnesota Office of the Revisor of Statutes, U.S. Geological Survey, U.S. Geological Survey, U.S. Geological Survey, U.S. Geological Survey.Mississippi
Historical record, Program requirements
3 sourced items are documented. Reporting duties, permitted quantities and reported use retain separate meanings.
Sources: Mississippi Department of Environmental Quality, Mississippi Department of Environmental Quality, U.S. Geological Survey, U.S. Geological Survey, U.S. Geological Survey, U.S. Geological Survey.Missouri
Historical record
3 sourced items are documented. Reporting duties, permitted quantities and reported use retain separate meanings.
Sources: Meta Platforms, U.S. Geological Survey, U.S. Geological Survey, U.S. Geological Survey, U.S. Geological Survey.Montana
Historical record, Program requirements
3 sourced items are documented. Reporting duties, permitted quantities and reported use retain separate meanings.
Sources: Montana Department of Natural Resources and Conservation, U.S. Geological Survey, U.S. Geological Survey, U.S. Geological Survey, U.S. Geological Survey.Nebraska
Enacted, Historical record, Program requirements
11 sourced items are documented. Reporting duties, permitted quantities and reported use retain separate meanings.
Sources: Google, Meta Platforms, Nebraska Legislature, Nebraska Legislature, Nebraska Department of Water, Energy, and Environment, operator submission by MARA Holdings, Nebraska Department of Water, Energy, and Environment, operator submission by Raven Northbrook LLC for Meta, Nebraska Department of Water, Energy, and Environment, operator submission by Google LLC, Nebraska Department of Water, Energy, and Environment, operator submission by Google LLC, Nebraska Department of Water, Energy, and Environment, operator submission by Google LLC, Nebraska Department of Water, Energy, and Environment, Nebraska Department of Water, Energy, and Environment, Nebraska Department of Water, Energy, and Environment, Nebraska Legislature, Nebraska Legislature, Nebraska Legislature, U.S. Geological Survey, U.S. Geological Survey, U.S. Geological Survey, U.S. Geological Survey.Nevada
Historical record
5 sourced items are documented. Reporting duties, permitted quantities and reported use retain separate meanings.
Sources: Google, Nevada Governor, U.S. Geological Survey, U.S. Geological Survey, U.S. Geological Survey, U.S. Geological Survey.New Hampshire
Historical record, Program requirements
3 sourced items are documented. Reporting duties, permitted quantities and reported use retain separate meanings.
Sources: New Hampshire General Court, U.S. Geological Survey, U.S. Geological Survey, U.S. Geological Survey, U.S. Geological Survey.New Jersey
Enacted, Historical record
3 sourced items are documented. Reporting duties, permitted quantities and reported use retain separate meanings.
Sources: New Jersey Legislature, Office of the Governor of New Jersey, U.S. Geological Survey, U.S. Geological Survey, U.S. Geological Survey, U.S. Geological Survey.New Mexico
Historical record
3 sourced items are documented. Reporting duties, permitted quantities and reported use retain separate meanings.
Sources: Meta Platforms, U.S. Geological Survey, U.S. Geological Survey, U.S. Geological Survey, U.S. Geological Survey.New York
Historical record, Program requirements
3 sourced items are documented. Reporting duties, permitted quantities and reported use retain separate meanings.
Sources: New York DEC, New York DEC, U.S. Geological Survey, U.S. Geological Survey, U.S. Geological Survey, U.S. Geological Survey.North Carolina
Historical record
4 sourced items are documented. Reporting duties, permitted quantities and reported use retain separate meanings.
Sources: Google, Meta Platforms, U.S. Geological Survey, U.S. Geological Survey, U.S. Geological Survey, U.S. Geological Survey.North Dakota
Historical record, Program requirements
3 sourced items are documented. Reporting duties, permitted quantities and reported use retain separate meanings.
Sources: North Dakota Department of Water Resources, U.S. Geological Survey, U.S. Geological Survey, U.S. Geological Survey, U.S. Geological Survey.Ohio
Historical record
6 sourced items are documented. Reporting duties, permitted quantities and reported use retain separate meanings.
Sources: Google, Meta Platforms, U.S. Geological Survey, U.S. Geological Survey, U.S. Geological Survey, U.S. Geological Survey.Oklahoma
Enacted, Historical record
4 sourced items are documented. Reporting duties, permitted quantities and reported use retain separate meanings.
Sources: Google, Oklahoma Legislature, Oklahoma House of Representatives, Oklahoma Legislature, U.S. Geological Survey, U.S. Geological Survey, U.S. Geological Survey, U.S. Geological Survey.Oregon
Historical record
5 sourced items are documented. Reporting duties, permitted quantities and reported use retain separate meanings.
Sources: Google, Meta Platforms, City of Hillsboro document hosted by Oregon Legislative Assembly, U.S. Geological Survey, U.S. Geological Survey, U.S. Geological Survey, U.S. Geological Survey.Pennsylvania
Enacted, Historical record
3 sourced items are documented. Reporting duties, permitted quantities and reported use retain separate meanings.
Sources: Pennsylvania General Assembly, U.S. Geological Survey, U.S. Geological Survey, U.S. Geological Survey, U.S. Geological Survey.Rhode Island
Enacted, Historical record
3 sourced items are documented. Reporting duties, permitted quantities and reported use retain separate meanings.
Sources: Rhode Island Department of State Water Resources Board, U.S. Geological Survey, U.S. Geological Survey, U.S. Geological Survey, U.S. Geological Survey.South Carolina
Historical record, Program requirements
4 sourced items are documented. Reporting duties, permitted quantities and reported use retain separate meanings.
Sources: Google, South Carolina Department of Environmental Services, U.S. Geological Survey, U.S. Geological Survey, U.S. Geological Survey, U.S. Geological Survey.South Dakota
Historical record, Program requirements
3 sourced items are documented. Reporting duties, permitted quantities and reported use retain separate meanings.
Sources: South Dakota DANR, South Dakota DANR, U.S. Geological Survey, U.S. Geological Survey, U.S. Geological Survey, U.S. Geological Survey.Tennessee
Historical record, Program requirements
5 sourced items are documented. Reporting duties, permitted quantities and reported use retain separate meanings.
Sources: Google, Meta Platforms, Tennessee Department of Environment and Conservation, U.S. Geological Survey, U.S. Geological Survey, U.S. Geological Survey, U.S. Geological Survey.Texas
Historical record
9 sourced items are documented. Reporting duties, permitted quantities and reported use retain separate meanings.
Sources: Google, Meta Platforms, Texas Water Development Board, Texas Water Development Board, Microsoft, U.S. Geological Survey, U.S. Geological Survey, U.S. Geological Survey, U.S. Geological Survey.Utah
Enacted, Historical record
4 sourced items are documented. Reporting duties, permitted quantities and reported use retain separate meanings.
Sources: Utah Legislature, Meta Platforms, U.S. Geological Survey, U.S. Geological Survey, U.S. Geological Survey, U.S. Geological Survey.Vermont
Historical record, Program requirements
3 sourced items are documented. Reporting duties, permitted quantities and reported use retain separate meanings.
Sources: Vermont Department of Environmental Conservation, Vermont General Assembly, Vermont General Assembly, Vermont General Assembly, U.S. Geological Survey, U.S. Geological Survey, U.S. Geological Survey, U.S. Geological Survey.Virginia
Enacted, Historical record
13 sourced items are documented. Reporting duties, permitted quantities and reported use retain separate meanings.
Sources: Google, Meta Platforms, Virginia General Assembly, Virginia Code Commission, Virginia State Corporation Commission, Microsoft, Western Virginia Water Authority and Helio Capital LLC; publicly hosted copy, U.S. Geological Survey, U.S. Geological Survey, U.S. Geological Survey, U.S. Geological Survey.Washington
Historical record
4 sourced items are documented. Reporting duties, permitted quantities and reported use retain separate meanings.
Sources: Microsoft, U.S. Geological Survey, U.S. Geological Survey, U.S. Geological Survey, U.S. Geological Survey.West Virginia
Historical record, Program requirements
3 sourced items are documented. Reporting duties, permitted quantities and reported use retain separate meanings.
Sources: West Virginia Legislature, West Virginia Legislature, West Virginia Legislature, U.S. Geological Survey, U.S. Geological Survey, U.S. Geological Survey, U.S. Geological Survey.Wisconsin
Historical record, Program requirements
4 sourced items are documented. Reporting duties, permitted quantities and reported use retain separate meanings.
Sources: Wisconsin Department of Natural Resources, Wisconsin Department of Natural Resources, City of Racine Water and Wastewater Utility, Wisconsin Department of Natural Resources, U.S. Geological Survey, U.S. Geological Survey, U.S. Geological Survey, U.S. Geological Survey.Wyoming
Historical record
3 sourced items are documented. Reporting duties, permitted quantities and reported use retain separate meanings.
Sources: Microsoft, U.S. Geological Survey, U.S. Geological Survey, U.S. Geological Survey, U.S. Geological Survey.
National context.
Amazon global 2025 water withdrawal and efficiency context
Global operator context, not a United States allocation or location measurement. Withdrawal volume, IT energy ratio, replenishment and different ownership populations retain separate meanings.
Amazon. Source: Publication date not stated. Checked: October 23, 2026.Full source details load when opened.
Meta global 2024 operational water, data center totals and construction boundary
Global operator reported 2024 water context. Operational and construction quantities, withdrawal and consumption, and IT energy efficiency remain separate. No US allocation, named site consumption, supply permit, actual compliance or independent assurance inferred.
Meta Platforms. Source: Publication date not stated. Checked: October 24, 2026.Full source details load when opened.
Latest source reviews.
Alabama historical2020 modeled thermoelectric water context
Historical record. USGS2008-2020 thermoelectric water-use reanalysis,published annual output filtered to2020:modeled annual-mean million gallons/day,not observed current2026 water use.958plant-year rows cover48conterminous states,not a complete facility census or data center inventory. Withdrawals include fresh/saline rows;consumption at coastal saline plants was not modeled.54Once-through saline source zero-consumption placeholders are excluded from consumption sums,not measured zero. State best/lower/upper figures are calculated sums of source plant model estimates and thermodynamic plausibility limits,not statewide statistical confidence intervals. Do not compare directly with2015county compilation as a measured trend;methods differ. HUC12 IDs and county labels do not certify parcels;README says public model-input coordinates use interpolated HUC12 centroids,not precise plant locations. No source coordinates adopted,site joins,permit/sustainable availability/datacenter allocation or causal inference.
U.S. Geological Survey. Source: October 31, 2023. Checked: October 27, 2026.Arkansas historical2020 modeled thermoelectric water context
Historical record. USGS2008-2020 thermoelectric water-use reanalysis,published annual output filtered to2020:modeled annual-mean million gallons/day,not observed current2026 water use.958plant-year rows cover48conterminous states,not a complete facility census or data center inventory. Withdrawals include fresh/saline rows;consumption at coastal saline plants was not modeled.54Once-through saline source zero-consumption placeholders are excluded from consumption sums,not measured zero. State best/lower/upper figures are calculated sums of source plant model estimates and thermodynamic plausibility limits,not statewide statistical confidence intervals. Do not compare directly with2015county compilation as a measured trend;methods differ. HUC12 IDs and county labels do not certify parcels;README says public model-input coordinates use interpolated HUC12 centroids,not precise plant locations. No source coordinates adopted,site joins,permit/sustainable availability/datacenter allocation or causal inference.
U.S. Geological Survey. Source: October 31, 2023. Checked: October 27, 2026.Arizona historical2020 modeled thermoelectric water context
Historical record. USGS2008-2020 thermoelectric water-use reanalysis,published annual output filtered to2020:modeled annual-mean million gallons/day,not observed current2026 water use.958plant-year rows cover48conterminous states,not a complete facility census or data center inventory. Withdrawals include fresh/saline rows;consumption at coastal saline plants was not modeled.54Once-through saline source zero-consumption placeholders are excluded from consumption sums,not measured zero. State best/lower/upper figures are calculated sums of source plant model estimates and thermodynamic plausibility limits,not statewide statistical confidence intervals. Do not compare directly with2015county compilation as a measured trend;methods differ. HUC12 IDs and county labels do not certify parcels;README says public model-input coordinates use interpolated HUC12 centroids,not precise plant locations. No source coordinates adopted,site joins,permit/sustainable availability/datacenter allocation or causal inference.
U.S. Geological Survey. Source: October 31, 2023. Checked: October 27, 2026.
Only states with sourced items have layer pages. A missing review is not a finding that a tariff, permit, program or reporting rule is absent.
Explore the infrastructure layers.
Download these findings with their sources
Unknown fields are withheld. The Atlas compilation license remains awaiting the owner decision. Original source terms and credits remain separate.
Updated . What changed: Latest source review in this evidence collection. It does not establish a site outcome.