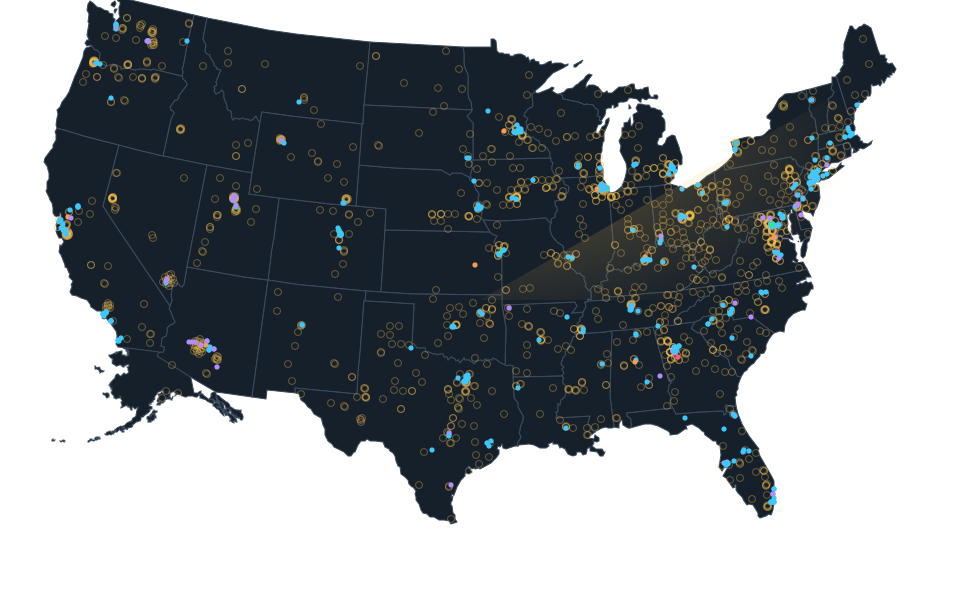
Alabama data center water reporting and use.
4 sourced items are documented. Reporting duties, permitted quantities and reported use retain separate meanings.
Historical record. Checked: October 27, 2026.
Evidence applies only to the subjects and dates in the linked sources. State context does not assign a tariff, permit or quantity to every facility.
Open the Alabama data center map.
Sourced findings.
Google Jackson County 2025 water reporting
Google reported location totals only, potentially covering multiple facilities. These are not all operators in a city or state, approved supply allocations or an individual building reading.
Google. Source: Publication date not stated. Checked: October 23, 2026.Full source details load when opened.
Meta Huntsville 2024 water withdrawal
Meta reported named facility withdrawal for 2024. The label may cover a campus; it is not an independent Atlas building measurement, statewide demand, approved allocation or future water requirement. Original megaliter unit and unknown site consumption remain explicit.
Meta Platforms. Source: Publication date not stated. Checked: October 23, 2026.Full source details load when opened.
Alabama historical thermoelectric water context
Historical2015 state thermoelectric power estimates, including fresh and saline water. Not current2026 conditions, data center facility use, drinking water demand, permit allocation or proof of a data center effect. Withdrawal, total water use including deliveries and reclaimed wastewater, and consumptive use are distinct. Consumption may exceed withdrawal because other supplied water is included. Independent rounding is retained; no facility joins or per kWh allocation.
U.S. Geological Survey. Source: Publication date not stated. Checked: October 26, 2026.Full source details load when opened.
Alabama historical2020 modeled thermoelectric water context
USGS2008-2020 thermoelectric water-use reanalysis,published annual output filtered to2020:modeled annual-mean million gallons/day,not observed current2026 water use.958plant-year rows cover48conterminous states,not a complete facility census or data center inventory. Withdrawals include fresh/saline rows;consumption at coastal saline plants was not modeled.54Once-through saline source zero-consumption placeholders are excluded from consumption sums,not measured zero. State best/lower/upper figures are calculated sums of source plant model estimates and thermodynamic plausibility limits,not statewide statistical confidence intervals. Do not compare directly with2015county compilation as a measured trend;methods differ. HUC12 IDs and county labels do not certify parcels;README says public model-input coordinates use interpolated HUC12 centroids,not precise plant locations. No source coordinates adopted,site joins,permit/sustainable availability/datacenter allocation or causal inference.
U.S. Geological Survey. Source: October 31, 2023. Checked: October 27, 2026.Full source details load when opened.
Explore data center records.
These records are in Alabama. State evidence does not establish an individual record match.
- Alabama Supercomputer Center
- DC BLOX Birmingham Data Center Campus
- DC BLOX Huntsville Data Center
- Google Jackson County Campus
- Meta Huntsville Data Center Campus
- RSA Dexter Avenue Datacenter
- Simple Helix Data Center
- Applied Digital Delta Forge 2 (Brookwood AI Factory Campus)
- Edged Prichard Data Center (Project Gateway)
- Nebius Birmingham AI Factory (BHM01)
- Project Red Clay
- Calvert Infrastructure Hub
Find the full record collection on the state map.
Updated . What changed: Latest source review in this evidence collection. It does not establish a site outcome.